General Phonetics
Louis Goldstein
Measuring F0 Contours using Praat
I. Introduction
It is easy to measure fundamental frequency at a given point in time from the duration of the fundamental period. However, if we want to know exactly how F0 changes over time in the course of an utterance (the F0 contour), it would be very time-consuming to measure the duration of each pitch period. There are, therefore, useful mathematical algorithms that calculate how F0 changes over time. These algorithms are not fool-proof (it turns out that automatically measuring F0 is not an easy problem), so sometimes you have to adjust parameters of the analysis to get a satisfactory result. F0 measurement in Praat seems to work quite well.
II. Getting the Pitch Contour of a given utterance
(1) Launch Praat and open the file containing the utterance whose F0 contour you wish to measure, by selecting Read from File... from the Read menu. A corresponding Sound should appear in the list of Praat Objects.
(2) Select the sound from the list of objects and click on Edit. You will get the familiar waveform and/or spectrogram display.
(3) From the View menu of the Edit window, select Show Analyses... In the resulting dialog box, check Show Pitch, and unchecked everything else.
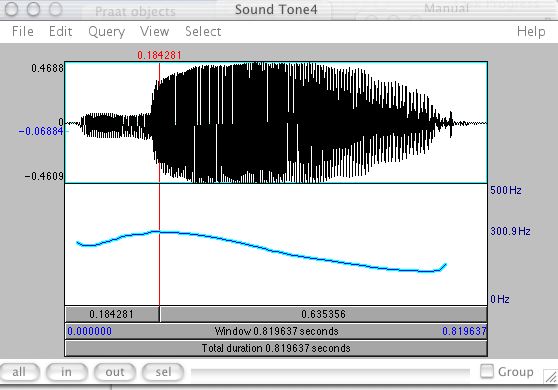
(4) You should now see a display like Figure 1 below, with the Waveform on top and F0 contour on the bottom.
(5) If the curve looks the way you expect, then you are done. However, sometimes there will be sharp jumps in the pitch contour (which are physically impossible), or places with no pitch values (i.e. voiceless according to the algorithm) where the signal is actually voiced, or conversely, voiceless intervals where some pitch value is found. If there is such a problem, you will need to adjust the analysis parameters. The most common ones that need adjusting are the minimum and maximum F0 values used for the analysis. These can be set depending on the pitch range of the speaker. For a male, a reasonable range is 75 - 300 Hz, for a female, 100 -600 Hz. The default settings in Praat are 75 - 500 Hz. These worked fine for the female speaker that is presented in these notes. To adjust the min and max (and other parameters), select Pitch Settings... from the Pitch menu of the Edit window. For other parameters, select Advanced Pitch Settings... from the Pitch menu. For an explanation of them, you can consult online Praat help, which I have reproduced here.
(6) As you move the cursor, the value of pitch is displayed on the screen. So you could, for example measure the minimum and maximum values.
(7) If you want to save pitch contour into a picture file that you can incorporate into a document, (or if you want can superimpose several contours), select Extract Visible Pitch Contour from the Pitch menu of the Edit window. A new object will appear in the list of Praat objects called Pitch untitled, which you can rename.
III. Drawing pitch contours in the Praat picture window
(1) Go to the Praat picture window. When you click in the window, you will see a small square highlighted. This is current drawing area. To select a larger area, hold down the mouse and move over the area you want to draw in.
(2) Go to the Praat objects window and select the Pitch object you wish to draw. Click the Draw button and select Draw... from the pop-up menu.
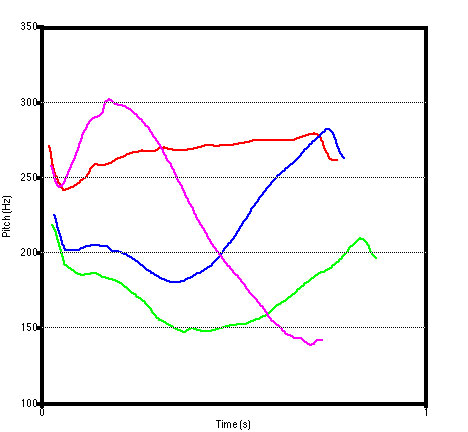
(3) In the resulting dialog box, set the plot ranges (time and frequency). If you set the start time and end times both to 0, it will plot the entire signal. In the example below, I superimpose several pitch contours, so I choose explicit start and end times (0 and 1 second respectively). The plot will then appear in the window.
(4) If you repeat step (3) with another pitch contour, then the two will be superimposed in the drawing window. When doing this, it is helpful to differentiate the plotted curves by means of color or texture or line thickness. You can select these options from the Pen menu in the picture window. You have to set these options before you do the drawing!
(5) You can add grid lines to your drawing by selecting for example, Marks left every... from the Margins menu in the picture window. In the resulting dialog box, type 1 for units (that will make the units equal to the default units (Hz), and type a number for distance, whch will be the nuimber of Hz between marks., Then select whether you want tick marks, grid lines, and/or numbers. In the plot below, in which four pitch contours are superimposed, I specified 50 Hz per mark, and I selected ticks, numbers and lines.
(6) From the File menu of the picture window, the resulting picture can be copied to the clipboard (and then pasted to Word, for example), or saved as a picture file or an eps file.