We present a framework for estimating race from faces in movie data. Please refer to a detailed survey “Learning race from face: A survey”, Fu S. et. al., 2014 for a discussion on studies on recognizing race from faces. The definitions and taxonomy of race from a computer vision perspective are borrowed from this survey. The list of sources we used can be found here.
Table of contents
- Data preparation
- Sample size
- Model architecture
- Performance evaluation
i. Confusion matrix and accuracy
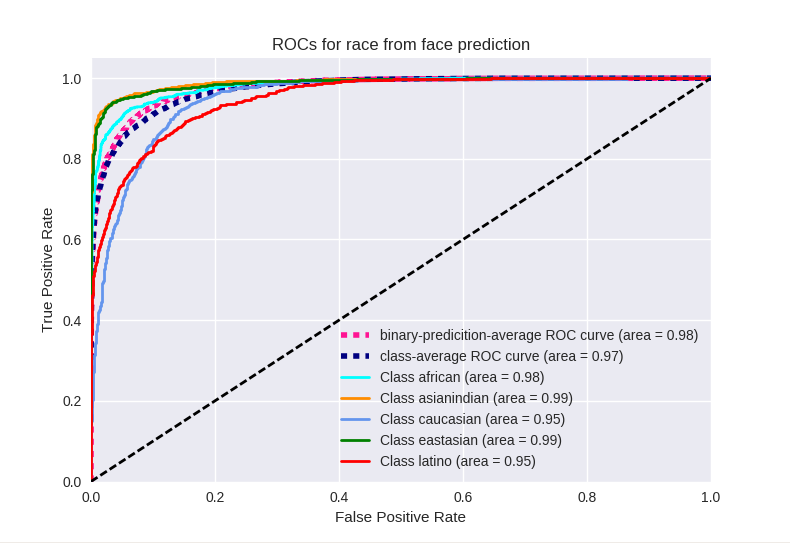
ii. ROC curves - What is the network learning?
Data and model architecture
We compiled face data across opensource databases which have clear definitions of labeling races and are consistent with our nomenclature. Additionally, we annotated race for IMDb identities as described in Ramakrishna et. al., 2017, ACL. Sources which required institutional EULA agreements were excluded due to the processing delays involved.
Data preparation
- All face images were resized to 100x100 and were converted to grayscale. Since a good number of images in our database were grayscale images, we converted all images to grayscale images
- Skin color has been shown to be one of the least important factors in race prediction (See survey)
- All images were aligned to achieve in-plane rotation to align landmarks of eyes and nose
- Left-right flipping of the images was performed for data augmentation
- Test images for evaluation were chosen to have no overlap of the person’s identity with the training data as well as to be variable with respect to pose, illumination, background and occlusions
- Due to lack of data from the nativeamerica/pacificislander class, we only considered the other five classes in our prediction model
race num_faces num_images eastasian 14472 28133 caucasian 267478 529741 latino/hispanic 10912 21374 asian-indian 28132 55473 african/african-american 22646 44627 nativeamerican/pacificislander 580 1069 TOTALs 344220 680417
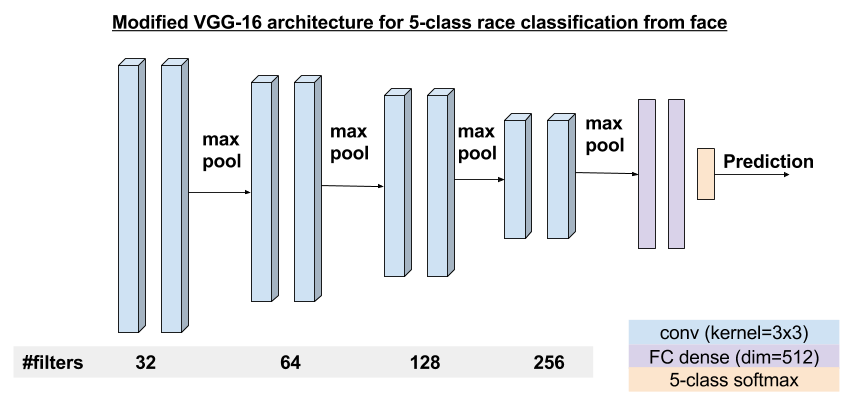
Model architecture
A simple modified VGG-like architecture was adopted for a 5-class race classification model. The architecture is as shown below.
Performance Evaluation
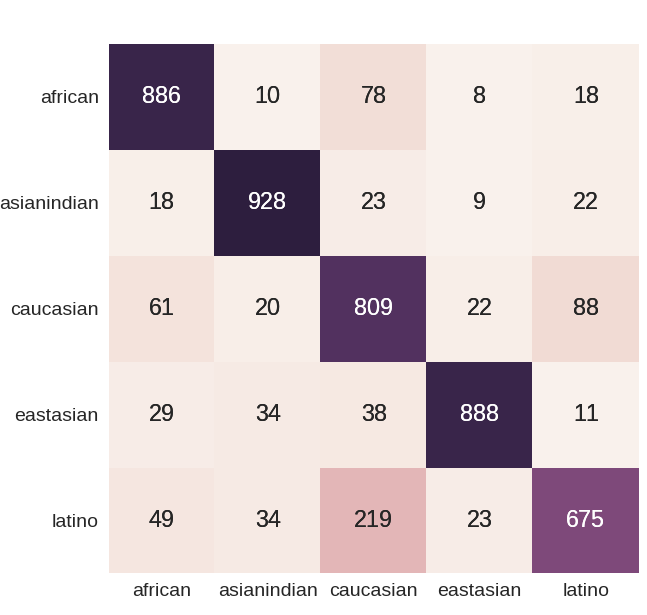
- Class-wise system performance is tabulated below. Overall system performance accuracy was 82.6% for a training setup of mini-batch size 32, trained for 50 epochs.
| Race | african | asianindian | caucasian | eastasian | latino |
|---|---|---|---|---|---|
| accuracy (%) | 83.2 | 85.9 | 93.2 | 87.4 | 65.6 |
Confusion matrix
What is the network learning
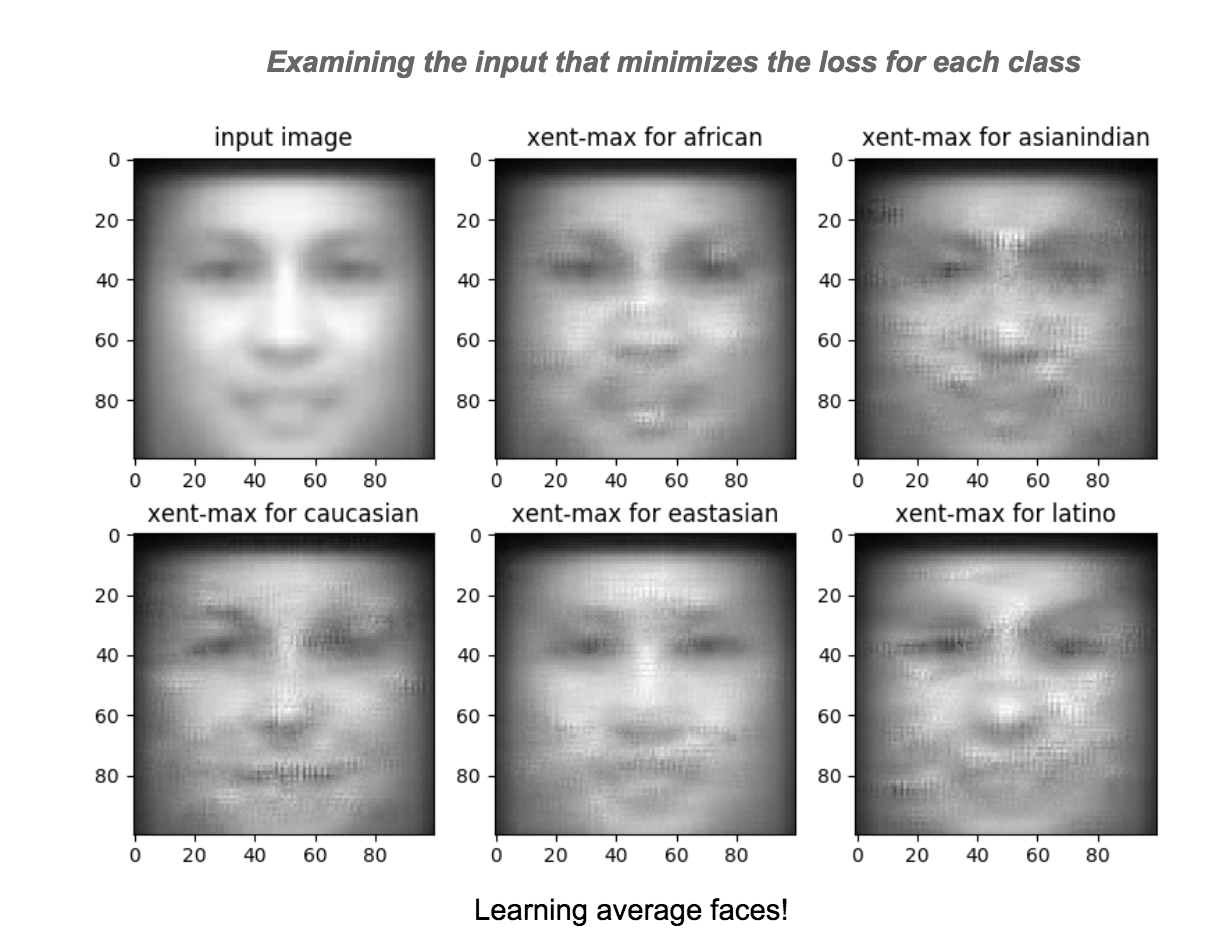
We were inspired by visualizing filter activations in a CNN as described here and extended the concept to identify the input (or distorted input) that minimizes the output loss for each class. In this, we initialize the input with an average face and minimize the categorical cross entropy loss for each class and visualize the changes to the input that achieves this minimization. The resulting modified inputs are shown below.
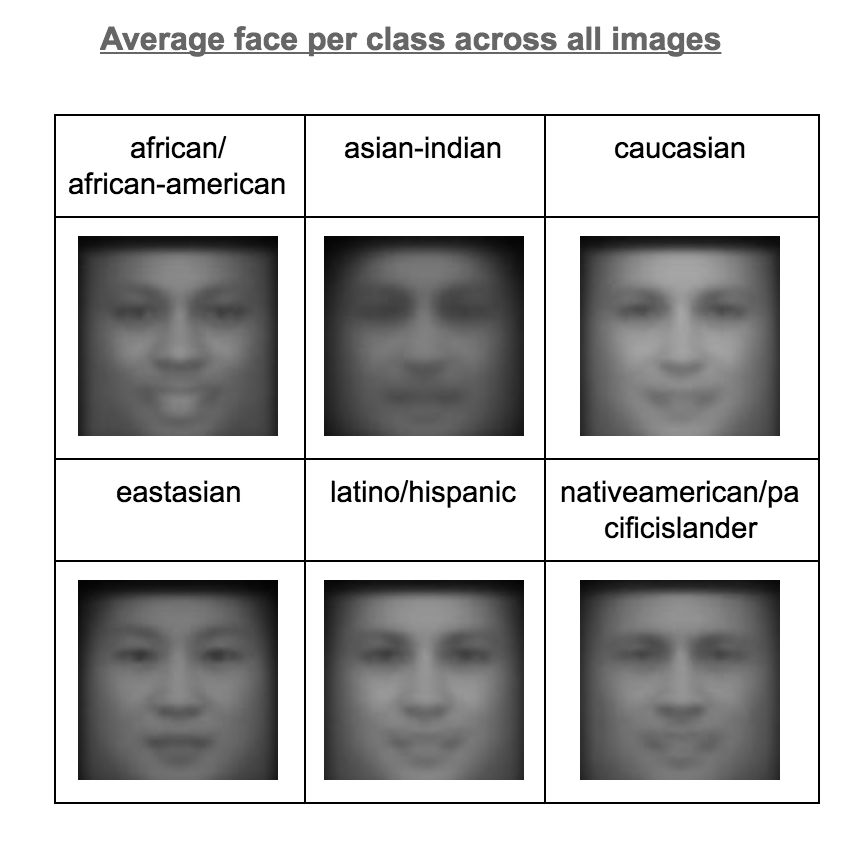
Not surprisingly, the modified inputs resemble the per-class average faces and are quite distinct. The results were similar when the input was initialized by average face from a specific class, rather than across all images.